Image Details
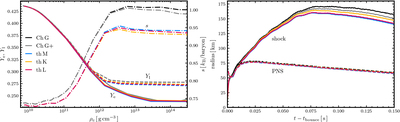
Caption: Figure 20.
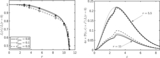
Central electron fraction (Ye; solid lines), lepton fraction (Yl; dashed lines), and entropy per baryon (s; dashed–dotted lines) vs. central density during core-collapse (left panel), and postbounce evolution of shock (solid lines) and PNS (dashed lines) radii (right panel). The different line colors correspond to a fiducial CHIMERA G-series run (Ch G; black), a CHIMERA G-series run with modified flux-limiter (Ch G+; gray), and three thornado+FLASH-X runs with different closures: Minerbo (th M; blue), Kershaw (th K; yellow), and Levermore (th L; red). In the left panel, due to differences in grid structure between codes, we calculate the central quantities as mass averaged over the innermost 0.01 M⊙.
Other Images in This Article
Show More
Copyright and Terms & Conditions
© 2026. The Author(s). Published by the American Astronomical Society.