Image Details
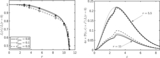
Caption: Figure 15.
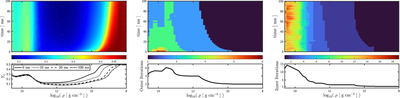
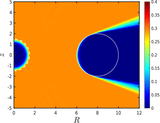
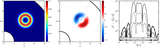
Results from the deleptonization problem. The color maps in the top row show the electron fraction (left), number of outer iterations (middle), and the average number of inner iterations per outer iteration (right) in the ﹩{{\mathrm{log}}}_{10}(\rho )﹩–t plane. The line plots in the bottom row show the electron fraction at select times (left), the time-averaged number of outer iterations (middle), and the time-averaged average number of inner iterations per outer iteration (right) vs. ﹩{{\mathrm{log}}}_{10}(\rho )﹩.
Other Images in This Article
Show More
Copyright and Terms & Conditions
© 2026. The Author(s). Published by the American Astronomical Society.
Copyright ©
2026 Astronomy Image Explorer. All Rights Reserved.