Image Details
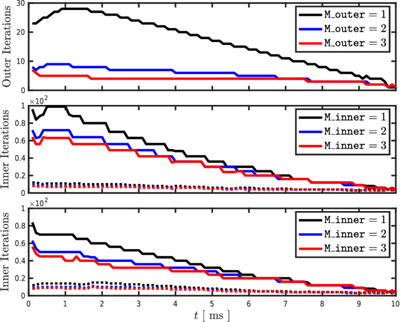
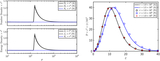
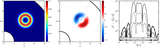
Caption: Figure 14.
Results from running the relaxation problem for various values of M_outer and M_inner for Δt = 0.1 ms. The top panel shows the number of outer iterations per time step vs. time for M_inner = 5 and M_outer = 1 (black), 2 (blue), and 3 (red). The middle panel shows the total (solid) and average (dotted) number of inner iterations per time step vs. time for M_outer = 2 and M_inner = 1 (black), 2 (blue), and 3 (red). The bottom panel shows the same quantities as the middle panel but for results obtained with M_outer = 3.
Other Images in This Article
Show More
Copyright and Terms & Conditions
© 2026. The Author(s). Published by the American Astronomical Society.
Copyright ©
2026 Astronomy Image Explorer. All Rights Reserved.