Image Details
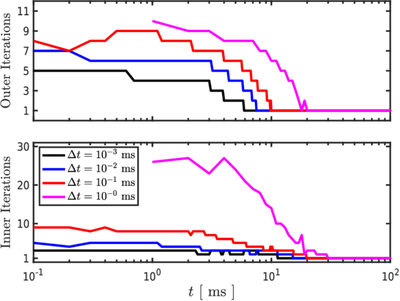
Caption: Figure 13.
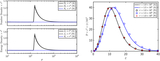
Results from running the relaxation problem using different time steps Δt. The top panel shows the number of outer iterations per time step vs. time. The bottom panel shows the average number of inner iterations per outer iteration per time step vs. time. Results are plotted for Δt = 10−3 ms (black), 10−2 ms (blue), 0.1 ms (red), and 1 ms (magenta).
Other Images in This Article
Show More
Copyright and Terms & Conditions
© 2026. The Author(s). Published by the American Astronomical Society.
Copyright ©
2026 Astronomy Image Explorer. All Rights Reserved.