Image Details
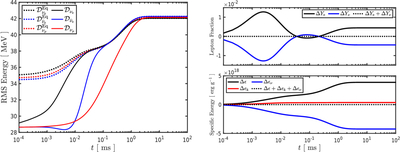
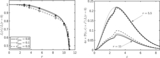
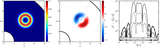
Caption: Figure 12.
Results for the relaxation problem. The left panel plots the rms energy, defined in Equation (154), vs. time for electron neutrinos (solid black), electron antineutrinos (solid blue), and muon neutrinos (solid red). The dotted black, blue, and red lines represent the corresponding rms energies computed with the respective equilibrium distributions. The top-right panel shows the change in the electron fraction (solid black), neutrino lepton fraction (solid blue), and total lepton fraction (dotted black) vs. time. The bottom-right panel shows the change in the specific internal energy (solid black), specific kinetic energy (solid red), specific Eulerian neutrino energy (solid blue), and total specific energy (dotted black) vs. time.
Other Images in This Article
Show More
Copyright and Terms & Conditions
© 2026. The Author(s). Published by the American Astronomical Society.