Image Details
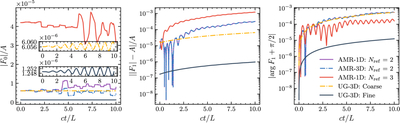
Caption: Figure 11.
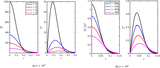
Results for the streaming sine wave test with AMR. Each panel shows the drift (left), change in amplitude (middle), and change in phase (right) of the wave relative to the expected solution. Results show the magnitudes and argument of the first few components of the spatial Fourier transform of the wave (see Equation (157)) and are scaled relative to the initial amplitude (A) and phase. Three AMR simulations, two-level refinement (Nref = 2) in 1D (solid purple) and 3D (dashed–dotted blue), and a three-level refinement (Nref = 3) in 1D (solid red), are compared against UG grids matching the coarsest (dashed–dotted yellow) and second (solid dark gray) refinement levels (the maximum refinement level for the Nref = 2 case). Insets in the left plot zoom in on the behavior of the drift for the two UG simulations.
Other Images in This Article
Show More
Copyright and Terms & Conditions
© 2026. The Author(s). Published by the American Astronomical Society.