Image Details
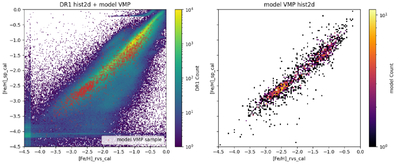
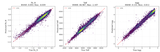
Caption: Figure 9.
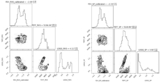
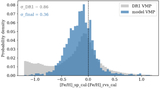
Location of the final VMP candidates in the DESI DR1 SP/RVS metallicity plane. Left: two-dimensional scatter plot of the full DR1 stellar sample in calibrated [Fe/H]RVS,cal versus [Fe/H]SP,cal, with color indicating the number of DR1 sources per bin. The main locus follows a tight diagonal sequence where the two pipelines agree, with additional low-density features toward the most metal-poor values. The 2569 VMP candidates selected by our dual-model framework are overplotted as red points and are seen to occupy preferentially the low-metallicity tail of the global distribution. Right: two-dimensional scatter plot of the VMP candidates alone in the same calibrated metallicity plane. The candidates cluster along the SP–RVS diagonal at [Fe/H] ≲ −2, with only a small fraction of objects deviating significantly from the one-to-one relation, indicating good internal consistency between the two pipelines for the selected sample.
Other Images in This Article
Show More
Copyright and Terms & Conditions
© 2026. The Author(s). Published by the American Astronomical Society.