Image Details
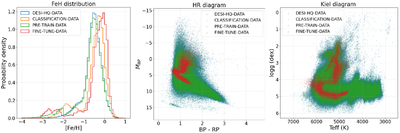
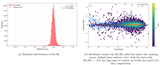
Caption: Figure 1.
Distributions of the datasets used in this work. Left: [Fe/H] for DESI-HQ-DATA, CLASSIFICATION-DATA, PRE-TRAIN-DATA, and FINE-TUNE-DATA, shown as normalized probability density functions. Middle: Gaia color–magnitude diagram (MBP versus BP − RP). Right: Kiel diagram (﹩\mathrm{log}g﹩ versus Teff).
Other Images in This Article
Show More
Copyright and Terms & Conditions
© 2026. The Author(s). Published by the American Astronomical Society.
Copyright ©
2026 Astronomy Image Explorer. All Rights Reserved.