Image Details
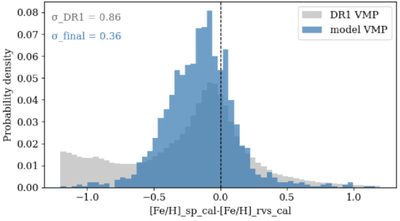
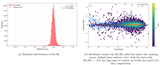
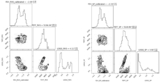
Caption: Figure 10.
Histogram of the metallicity residual [Fe/H]SP,cal–[Fe/H]RVS,cal for two samples. The gray histogram shows the DR1 VMP candidate pool, defined as all DR1 sources with either [Fe/H]SP,cal < −2 or [Fe/H]RVS,cal < −2, while the blue histogram shows the final intersected VMP sample selected in this work. The final sample displays a much narrower distribution strongly peaked near zero, in contrast to the broad residuals of the DR1 candidate pool.
Other Images in This Article
Show More
Copyright and Terms & Conditions
© 2026. The Author(s). Published by the American Astronomical Society.
Copyright ©
2026 Astronomy Image Explorer. All Rights Reserved.