

Image Details
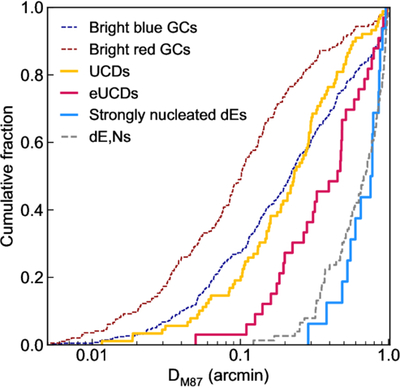
Caption: Figure 14.
Cumulative distributions for the projected distance from M87 (DM87) of UCDs (orange line), eUCDs (magenta line), and strongly nucleated dEs (blue line), compared to bright GCs (﹩{g}^{{\prime} }\lt 21.5﹩) and other nucleated dEs (gray dashed line).
Other Images in This Article
Show More
Copyright and Terms & Conditions
© 2026. The Author(s). Published by the American Astronomical Society.

Copyright ©
2026 Astronomy Image Explorer. All Rights Reserved.
