

Image Details
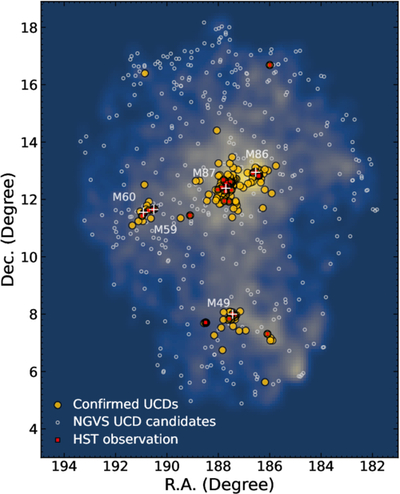
Caption: Figure 1.
Spatial distribution of 612 Virgo UCD candidates described in C. Liu et al. (2020). Filled yellow circles represent 203 confirmed UCDs at the beginning of this study. Open gray circles indicate UCD candidates without spectroscopic confirmation. Filled red squares indicate UCDs with available archive HST imaging as summarized in Section 2.2. The background map shows the galaxy surface density distribution of the Virgo Cluster compiled from NGVS. The spatial coverage of previous spectroscopic surveys is largely confined to the main subclusters of the Virgo Cluster.
Other Images in This Article
Show More
Copyright and Terms & Conditions
© 2026. The Author(s). Published by the American Astronomical Society.

Copyright ©
2026 Astronomy Image Explorer. All Rights Reserved.
