Image Details
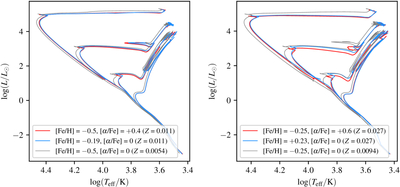
Caption: Figure 4.
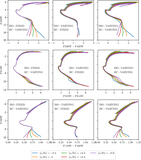
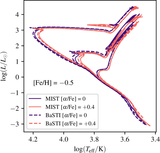
MIST isochrones at 10 Myr, 100 Myr, 1 Gyr, and 10 Gyr. The red line is the α-enhanced model with [Fe/H] = −0.5 (left) or −0.25 (right) while the blue line is made from a scaled-solar composition but interpolated to the same total Z as the red curve in each panel. For comparison, the gray lines are scaled-solar models with the same [Fe/H] as the red lines.
Other Images in This Article
Copyright and Terms & Conditions
© 2026. The Author(s). Published by the American Astronomical Society.
Copyright ©
2026 Astronomy Image Explorer. All Rights Reserved.