Image Details
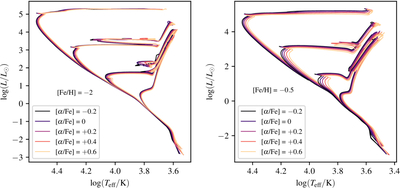
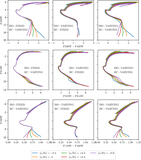
Caption: Figure 3.
MIST isochrones at 10 Myr, 100 Myr, 1 Gyr, and 10 Gyr, showing the effect of [α/Fe] enhancements across the range −0.2 to +0.6 in the theoretical H-R diagram. The left panel shows [Fe/H] = –2.0 and the right panel shows [Fe/H] = –0.5 isochrones.
Other Images in This Article
Copyright and Terms & Conditions
© 2026. The Author(s). Published by the American Astronomical Society.
Copyright ©
2026 Astronomy Image Explorer. All Rights Reserved.