Image Details
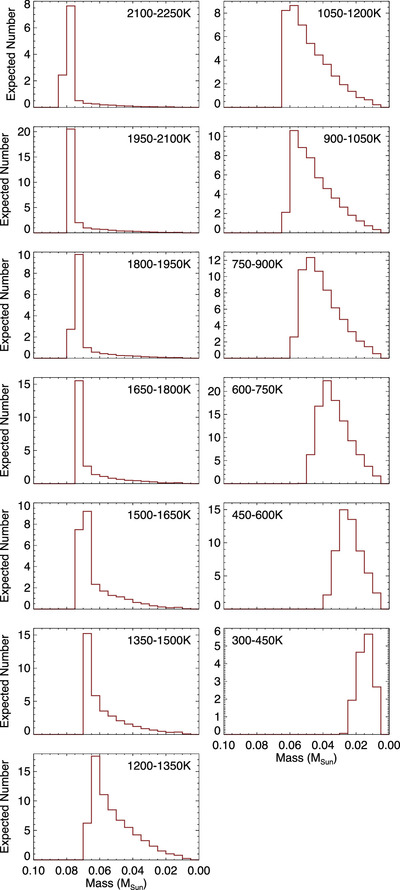
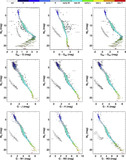
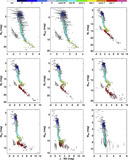
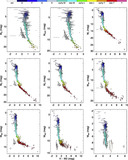
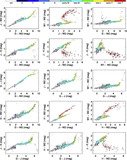
Caption: Figure 19.
The predicted distributions of brown dwarf masses in each of our 150 K effective temperature bins based on the best-fit Raghu et al. (2024) simulation to our measured L, T, and Y dwarf space densities (see text for details). Each histogram is scaled to match the total number of objects listed for that T eff bin in Table 17.
Other Images in This Article

Show More
Copyright and Terms & Conditions
© 2024. The Author(s). Published by the American Astronomical Society.
Copyright ©
2026 Astronomy Image Explorer. All Rights Reserved.