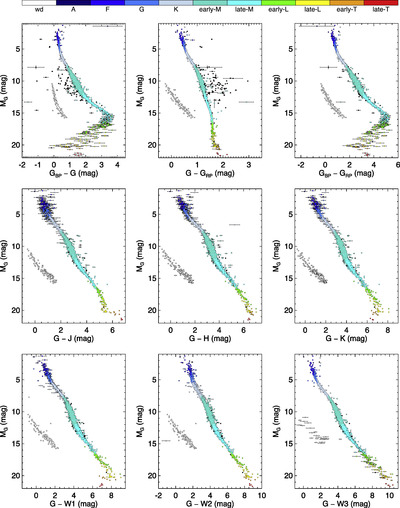
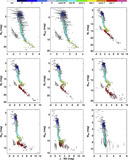
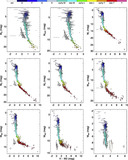
Image Details

Choose export citation format:

The Initial Mass Function Based on the Full-sky 20 pc Census of ∼3600 Stars and Brown Dwarfs

  • Authors: J. Davy Kirkpatrick, Federico Marocco, Christopher R. Gelino, Yadukrishna Raghu, Jacqueline K. Faherty, Daniella C. Bardalez Gagliuffi, Steven D. Schurr, Kevin Apps, Adam C. Schneider, Aaron M. Meisner, Marc J. Kuchner, Dan Caselden, R. L. Smart, S. L. Casewell, Roberto Raddi, Aurora Kesseli, Nikolaj Stevnbak Andersen, Edoardo Antonini, Paul Beaulieu, Thomas P. Bickle, Martin Bilsing, Raymond Chieng, Guillaume Colin, Sam Deen, Alexandru Dereveanco, Katharina Doll, Hugo A. Durantini Luca, Anya Frazer, Jean Marc Gantier, Léopold Gramaize, Kristin Grant, Leslie K. Hamlet, Hiro Higashimura, 村 滉 東, Michiharu Hyogo, Peter A. Jałowiczor, Alexander Jonkeren, Martin Kabatnik, Frank Kiwy, David W. Martin, Marianne N. Michaels, William Pendrill, Celso Pessanha Machado, Benjamin Pumphrey, Austin Rothermich, Rebekah Russwurm, Arttu Sainio, John Sanchez, Fyodor Theo Sapelkin-Tambling, Jörg Schümann, Karl Selg-Mann, Harshdeep Singh, Andres Stenner, Guoyou Sun, 国佑 孙, Christopher Tanner, Melina Thévenot, Maurizio Ventura, Nikita V. Voloshin, Jim Walla, Zbigniew Wędracki, Jose I. Adorno, Christian Aganze, Katelyn N. Allers, Hunter Brooks, Adam J. Burgasser, Emily Calamari, Thomas Connor, Edgardo Costa, Peter R. Eisenhardt, Jonathan Gagné, Roman Gerasimov, Eileen C. Gonzales, Chih-Chun Hsu, Rocio Kiman, Guodong Li, Ryan Low, Eric Mamajek, Blake M. Pantoja, Mark Popinchalk, Jon M. Rees, Daniel Stern, Genaro Suárez, Christopher Theissen, Chao-Wei Tsai, Johanna M. Vos, David Zurek

J. Davy Kirkpatrick et al 2024 The Astrophysical Journal Supplement Series 271 .

  • Provider: AAS Journals

Caption: Figure 5.

Absolute G-band magnitude plotted against various colors for the 20 pc census. See text for details. The spray of mostly black points (i.e., objects with no measured spectral types) to the left of the main sequence in the G BP G vs. M G diagram and to the right of the main sequence in the GG RP vs. M G diagram represents components in close binaries near the Gaia resolution limit. The G BP and G RP magnitudes are calculated from the fluxes in a 3.5 × 2.1 arcsec2 field, whereas the G magnitudes are calculated from a profile fit to a much higher-resolution image (Section 8 of Evans et al. 2018). For binaries just above the Gaia resolution limit, this means that per-component BP and RP fluxes will often include light from the other object, whereas the G flux will not (Halbwachs et al. 2023). This effect pushes such objects blueward in G BP G color and redward in GG RP color, as these diagrams show.

Other Images in This Article

Show More

Copyright and Terms & Conditions

Additional terms of reuse