

Image Details
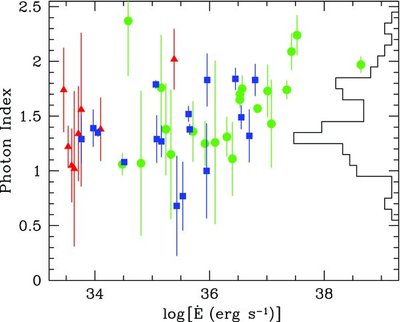
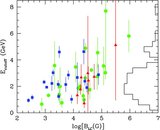
Caption: Figure 8.
Photon index Γ vs. the rotational energy-loss rate,
 . For Γ, the statistical uncertainties combined with the systematic uncertainties due to the diffuse emission model are shown.
An additional systematic bias of (+0.3, − 0.1) affects Γ (see the text). The histogram of the photon indices is projected
along the right-hand axis. Blue squares: gamma-ray-selected pulsars. Red triangles: millisecond gamma-ray pulsars. Green circles:
all other radio-loud gamma-ray pulsars.
. For Γ, the statistical uncertainties combined with the systematic uncertainties due to the diffuse emission model are shown.
An additional systematic bias of (+0.3, − 0.1) affects Γ (see the text). The histogram of the photon indices is projected
along the right-hand axis. Blue squares: gamma-ray-selected pulsars. Red triangles: millisecond gamma-ray pulsars. Green circles:
all other radio-loud gamma-ray pulsars.
Other Images in This Article
Show More
Copyright and Terms & Conditions
© 2010. The American Astronomical Society. All rights reserved.

Copyright ©
2026 Astronomy Image Explorer. All Rights Reserved.
