

Image Details
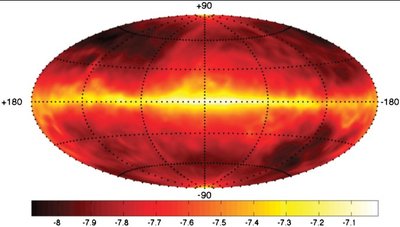
Caption: Figure 9.
Aitoff projection sky map of the 5σ sensitivity in units of logarithmic energy flux (Log( L γ) ph cm −2 s −1) for six months of Fermi-LAT sky-survey data. The sensitivity analysis uses the model of the diffuse gamma-ray background described in the text (Section 4), and pulsar spectra with differential photon indices of Γ = 1.4 with an exponential cutoff energy of E cutoff = 2.2 GeV.
Other Images in This Article
Show More
Copyright and Terms & Conditions
© 2010. The American Astronomical Society. All rights reserved.

Copyright ©
2026 Astronomy Image Explorer. All Rights Reserved.
