

Image Details
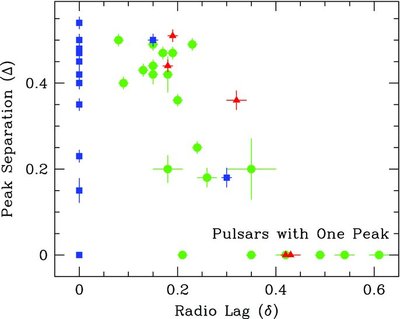
Caption: Figure 4.
Phase difference Δ between the gamma-ray peaks, vs. the phase lag δ between the main radio peak and the nearest gamma-ray peak. Pulsars without a radio detection are plotted with δ = 0. With present light curves we cannot generally measure Δ < 0.15; objects classified as single-peaked are plotted with Δ = 0. Two such objects, both MSPs, are off the plot at δ>0.8. Blue squares: gamma-ray-selected pulsars. Red triangles: millisecond gamma-ray pulsars. Green circles: all other radio-loud gamma-ray pulsars.
Other Images in This Article
Show More
Copyright and Terms & Conditions
© 2010. The American Astronomical Society. All rights reserved.

Copyright ©
2026 Astronomy Image Explorer. All Rights Reserved.
