

Image Details
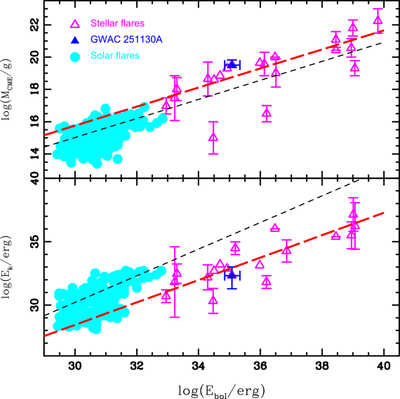
Caption: Figure 4.
Upper panel: mass of CME (MCME) plotted against the bolometric energy released in the flares (Ebol). The magenta triangles denote the stellar CME candidates including the GWAC 251130A reported in this study and the cases compiled from the literature (C. Argiroffi et al. 2019; S. Moschou et al. 2019; K. Namekata et al. 2021; J. Wang et al. 2021, 2022; J. Wang 2023; D. Cao & S. Gu 2026). The solar flare–CME events studied in S. Yashiro & N. Gopalswamy (2009) are shown by cyan circles. The red long-dashed line shows the best fit to the stellar CME candidates (see Equation (4) for details), while the black short-dashed line shows the best fit to these solar events (J. J. Drake et al. 2013). Lower panel: the same as the upper one, but for the Ek (the kinetic energy along the LOS) versus Ebol plot.
Other Images in This Article
Copyright and Terms & Conditions
© 2026. The Author(s). Published by the American Astronomical Society.

