

Image Details
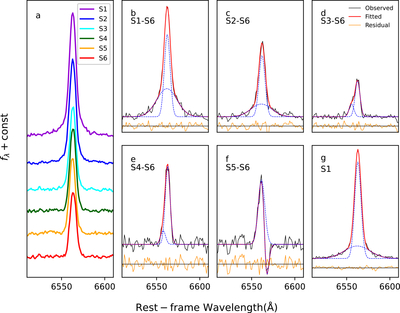
Caption: Figure 2.
Panel (a): temporal spectral sequence of the Hα emission line sorted with time from top to bottom. The spectra are shifted vertically by an arbitrary amount for clarity. Panels (b)–(f): modeling of differential Hα line profiles by a linear combination of a set of Gaussian emission (or absorption) components. In each panel, a local underlying continuum has already been removed from the differential spectrum before the line-profile modeling. The observed line profile is denoted by the black line, and the modeled one by the red solid lines. Each Gaussian function is shown by a blue dashed line. Note that, in order to highlight the decayed Hα emission line, the y-axis scale in panels (e) and (f) is smaller than that in panels (b)–(d). Panel (g): same as panels (b)–(f), but for the line profile without a subtraction of the reference spectrum S6.
Other Images in This Article
Copyright and Terms & Conditions
© 2026. The Author(s). Published by the American Astronomical Society.

