

Image Details
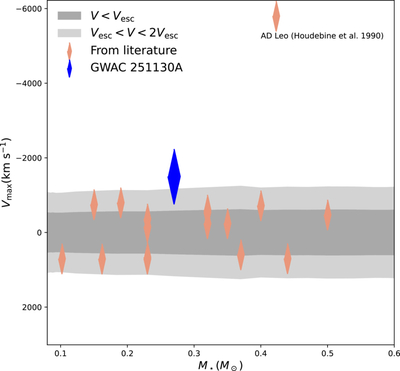
Caption: Figure 3.
The maximum projected velocity (﹩{V}_{{\rm{\max }}}﹩) measured from the high-velocity Balmer line wing plotted against the stellar mass for the CME candidates compiled from the literature (E. R. Houdebine et al. 1990; F. Koller et al. 2021; J. Wang et al. 2021, 2022; H.-P. Lu et al. 2022, 2025ba, 2025ab; C. Cai et al. 2026; D. Cao & S. Gu 2026), along with the current case GWAC 251130A. The size of the symbols is arbitrary. The dark and light gray regions mark the regions with ﹩{V}_{{\rm{\max }}}\lt {v}_{{\rm{esc}}}﹩ and ﹩{v}_{{\rm{esc}}}\lt {V}_{{\rm{\max }}}\lt 2{v}_{{\rm{esc}}}﹩, respectively, where vesc is the surface escape velocity calculated from the stellar mass and radius according to the mean stellar color and effective temperature sequence given in M. J. Pecaut et al. (2012) and M. J. Pecaut & E. E. Mamajek (2013).
Other Images in This Article
Copyright and Terms & Conditions
© 2026. The Author(s). Published by the American Astronomical Society.

