

Image Details
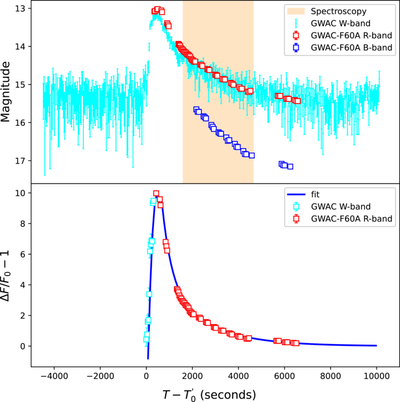
Caption: Figure 1.
Upper panel: the light curves monitored by SVOM/GWAC and the GWAC-F60A telescope for the stellar flare GWAC 251130A. T0 denotes the trigger time. The duration of our monitor in spectroscopy is marked by the shadowed region in light orange. Lower panel: the best fit to the WL/R-band light curve of GWAC 251130A by a combination of a linear rise and two exponential decay components.
Other Images in This Article
Copyright and Terms & Conditions
© 2026. The Author(s). Published by the American Astronomical Society.

Copyright ©
2026 Astronomy Image Explorer. All Rights Reserved.
