

Image Details
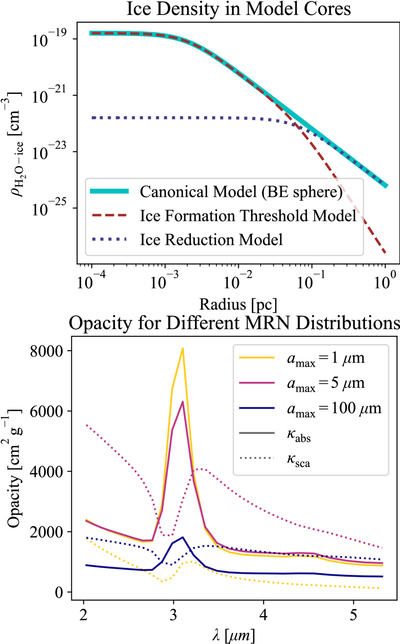
Caption: Figure 7.
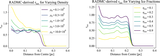
Top: ice density as a function of radius for the canonical model in Section 3.3 in cyan, and for the ice formation threshold and ice reduction models from Section 4.3 in brown and indigo, respectively. Bottom: opacity for our wavelength range of interest (2–5 μm) for typical grain size distributions used in ISM (MRN with ﹩{a}_{{\rm{\max }}}=1\,\mu ﹩m), for our canonical model grain size distribution (﹩{a}_{{\rm{\max }}}=5\,\mu ﹩m) and for the central large dust size distribution in Section 4.2 (﹩{a}_{{\rm{\max }}}=100\,\mu ﹩m).
Other Images in This Article
Copyright and Terms & Conditions
© 2026. The Author(s). Published by the American Astronomical Society.

Copyright ©
2026 Astronomy Image Explorer. All Rights Reserved.
