

Image Details
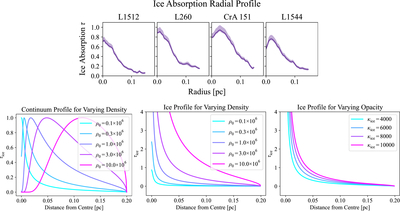
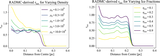
Caption: Figure 3.
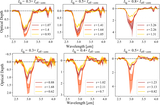
Top row: averaged radial profile of ice absorption depth τice (and ±1σ uncertainty band—upper error including an additional 10% for the unknown τice correction factor) observed in the four cores. The lower-density cores on the left (L1512 and L260) have a monotonically decreasing ice depth from the center outward. The higher-density cores on the right (CrA 151 and L1544) show a drop in ice absorption depth at the center. Bottom row: model-derived light profile and ice absorption profile as a function of radius for the prestellar core as described in Section 3.2—continuum profile for varying densities (left), ice absorption profile for varying densities (middle), and ice absorption profile for varying ice opacities (right).
Other Images in This Article
Copyright and Terms & Conditions
© 2026. The Author(s). Published by the American Astronomical Society.

