

Image Details
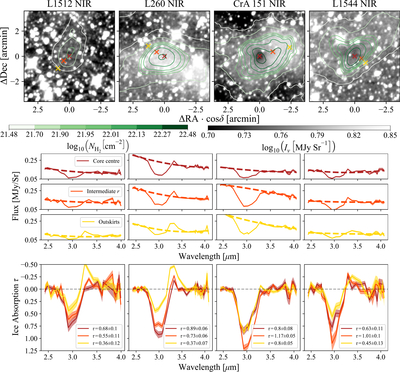
Caption: Figure 1.
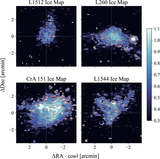
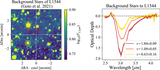
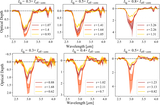
Continuum flux maps and spectra for four prestellar cores. The top row shows the continuum flux at 3.4 μm from WISE, and contours of ﹩{\mathrm{log}}_{10}\left({N}_{{{\rm{H}}}_{2}}\right)﹩ estimated using Herschel. In each core, we pick three representative points marked with crosses, starting at the center (dark red) and going outward (orange to yellow), chosen to avoid intersecting background star sight lines. These points probe decreasing ﹩{N}_{{{\rm{H}}}_{2}}﹩ values as shown by the contours. The middle row gives the spectrum (and ±1σ uncertainty band) for each of these three points in the same color as their respective markers, along with the fitted continuum in a dotted line, as described in Section 2. The bottom row shows the optical depth computed with respect to this continuum, where the ice absorption feature strengths can be compared. The full ice absorption maps and spatial trends are shown in Figure 2. Apart from the 3 μm ice absorption band, we also see the 3.3 μm PAH emission in L260, L1512, and L1544.
Other Images in This Article
Copyright and Terms & Conditions
© 2026. The Author(s). Published by the American Astronomical Society.

