

Image Details
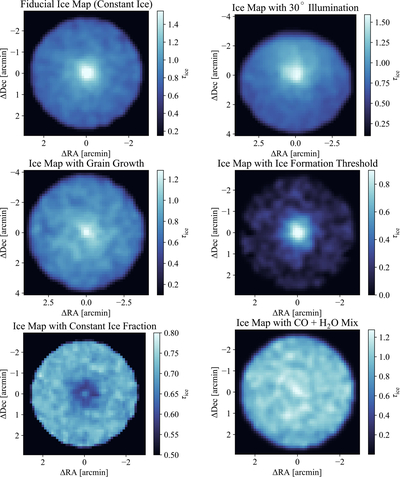
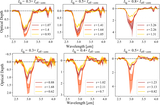
Caption: Figure 6.
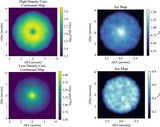
RADMC-3D derived ice absorption map for Top left: the fiducial cloud for a constant ηice = 40%, same as Figure 4, for comparison. Top right: a cloud illuminated at 30∘ to the LoS, the source of illumination being in the top part of the image. Middle left: a cloud where central regions have grain sizes reaching up to 100 μm instead of 5 μm. Middle right: a cloud where ice formation primarily happens at densities ﹩{n}_{{{\rm{H}}}_{2}}\,\geqslant \,1{0}^{4}﹩ cm−3. Bottom left: a cloud where ice density becomes constant/saturates above gas densities of ﹩{n}_{{{\rm{H}}}_{2}}\,\geqslant \,1{0}^{4}﹩ cm−3, and does not scale with the increasing gas/dust density. Bottom right: a cloud where ice changes from being pure H2O, to a mix of a 3:1 mix of CO and H2O ice, at densities ﹩{n}_{{{\rm{H}}}_{2}}\,\geqslant \,1{0}^{4}﹩ cm−3.
Other Images in This Article
Copyright and Terms & Conditions
© 2026. The Author(s). Published by the American Astronomical Society.

