

Image Details
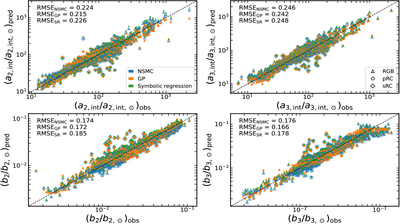
Caption: Figure E1.
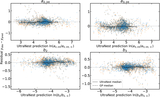
Observed versus predicted normalized amplitudes and characteristic frequencies for the GP test sample. UltraNest (Bayesian), GP, and symbolic-regression predictions are shown in blue, orange, and green, respectively; symbols denote RGB, pRC, and sRC stars. RMSE values are given for each panel.
Other Images in This Article
Copyright and Terms & Conditions
© 2026. The Author(s). Published by the American Astronomical Society.

Copyright ©
2026 Astronomy Image Explorer. All Rights Reserved.
