

Image Details
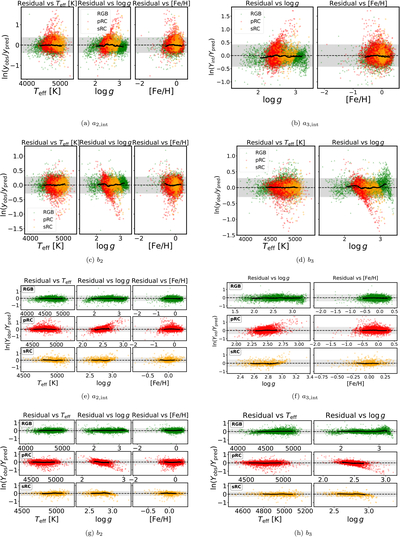
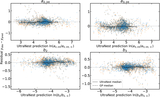
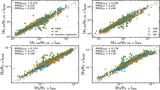
Caption: Figure 2.
Residuals of the predicted versus observed comparison, ﹩\mathrm{ln}({Y}_{{\rm{obs}}}/{Y}_{{\rm{pred}}})﹩, for a2,int, a3,int, b2, b3, as a function of Teff, ﹩\mathrm{log}g﹩, and [Fe/H] were included in the adopted model, for the full sample. The black line shows a running median; the shaded band indicates the ±2σ region. Top row (a)–(d): full sample, color coded by evolutionary phase. Bottom row (e)–(h): the same residuals separated into individual RGB (top), pRC (middle), and sRC (bottom) subpanels, with the running median computed independently within each evolutionary phase
Other Images in This Article
Copyright and Terms & Conditions
© 2026. The Author(s). Published by the American Astronomical Society.

Copyright ©
2026 Astronomy Image Explorer. All Rights Reserved.
