

Image Details
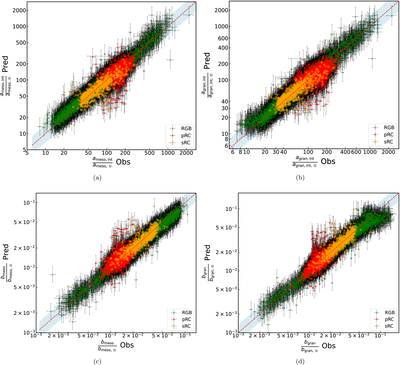
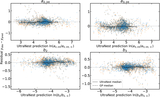
Caption: Figure 1.
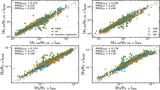
Predicted versus observed values of [ameso/ameso,⊙, agran/agran,⊙, bmeso/bmeso,⊙/bgran/bgran,⊙], using the best-fit scaling relation from Table 1. Points are color coded by evolutionary phase (RGB: green triangles; pRC: red circles; sRC: orange diamonds); error bars reflect measurement uncertainties. The red dashed line marks the one-to-one relation; the shaded blue band shows the ±2σ scatter about this relation.
Other Images in This Article
Copyright and Terms & Conditions
© 2026. The Author(s). Published by the American Astronomical Society.

Copyright ©
2026 Astronomy Image Explorer. All Rights Reserved.
