

Image Details
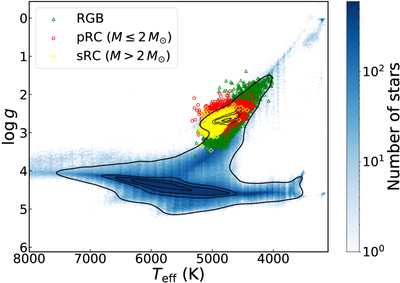
Caption: Figure A1.
Distribution of sample stars in the Teff–﹩\mathrm{log}g﹩ plane. The blue background shows the density of the entire Kepler sample. Green triangles mark RGB stars, red circles indicate pRC (M ≤ 2M⊙) stars, and yellow diamonds denote sRC (M > 2M⊙) stars.
Other Images in This Article
Copyright and Terms & Conditions
© 2026. The Author(s). Published by the American Astronomical Society.

Copyright ©
2026 Astronomy Image Explorer. All Rights Reserved.
