

Image Details
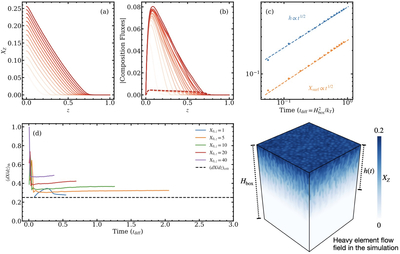
Caption: Figure B1.
Results of the 3D simulations of an accretion-driven thermohaline front. Panels (a)–(c) and the 3D visualization correspond to the reference run with X0,z = 10. Panel (a): horizontally averaged mass fraction of heavy elements XZ as a function of depth z (measured from the top of the box), at different times (light to dark red). Panel (b): turbulent (solid) and molecular diffusion (dashed) composition fluxes at the same times. Panel (c): thermohaline layer depth h (blue, in units of Hbox) and surface abundance Xsurf (orange, in units of ΔX) as a function of time (in units of tdiff). Dashed lines are power-law fits, both consistent with t1/2, as predicted by the shallow-layer model. Panel (d): composition gradient averaged over the thernohaline region, as a function of time for the five values of the imposed flux. The dashed line marks the critical gradient (dX/dz)crit = R0/Le = 0.25. Bottom right: 3D visualization of the heavy elements in the simulation box, showing the thermohaline fingers carrying heavy elements downward from the source at the top.
Other Images in This Article
Copyright and Terms & Conditions
© 2026. The Author(s). Published by the American Astronomical Society.

