

Image Details
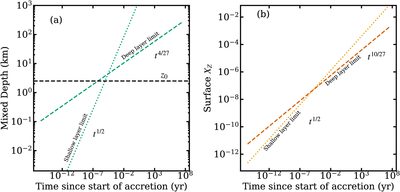
Caption: Figure 3.
Evolution of the thermohaline layer using the parameters of G 29–38 for an accretion rate ﹩{\dot{M}}_{{\rm{acc}}}=1{0}^{10}\,{\rm{g}}\,{{\rm{s}}}^{-1}﹩. Panel (a): thermohaline layer depth h(t) as a function of time since the onset of accretion. Panel (b): mass fraction of heavy elements at the surface, Xsurf(t) over the same period. In both panels, the dotted and dashed lines show the shallow-layer and deep-layer asymptotic scalings, respectively. The horizontal dashed line in panel (a) marks the scale height z0 = (17/4)H0 ≈ 2.5 km, which sets the transition between the two regimes.
Other Images in This Article
Copyright and Terms & Conditions
© 2026. The Author(s). Published by the American Astronomical Society.

Copyright ©
2026 Astronomy Image Explorer. All Rights Reserved.
