

Image Details
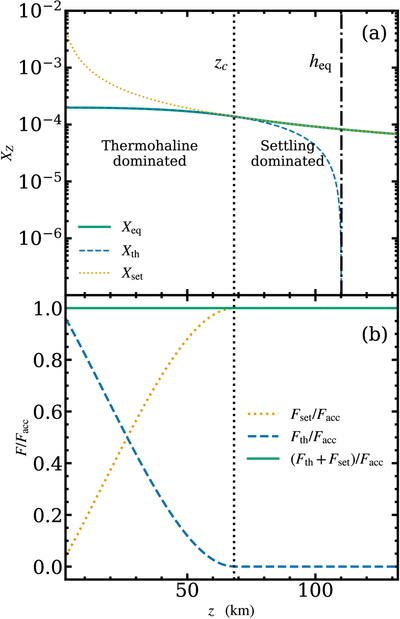
Caption: Figure 4.
Equilibrium profiles as a function of depth z. Panel (a): heavy-element mass fraction XZ. Dotted and dashed curves show the profiles expected from gravitational settling alone (Xset) and thermohaline convection alone (Xth). The solid curve is the equilibrium profile Xeq obtained when both processes operate together and the resulting total flux becomes constant (see the text). The dotted vertical line marks the critical depth zc below which settling dominates over thermohaline mixing, and the dotted–dashed line marks the equilibrium mixed-layer depth heq. Panel (b): corresponding heavy-element fluxes at equilibrium, normalized to the accretion flux Facc. Dashed and dotted curves show the thermohaline (Fth) and settling (Fset) contributions, whereas the solid curve shows the total flux.
Other Images in This Article
Copyright and Terms & Conditions
© 2026. The Author(s). Published by the American Astronomical Society.

