

Image Details
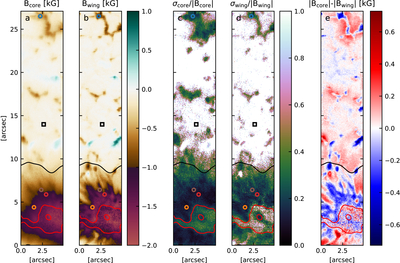
Caption: Figure 4.
Results of the application of the WFA. Panel (a): LOS magnetic field strength retrieved from the core wavelengths. Panel (b): LOS magnetic field strength retrieved from the wing wavelengths. Panel (c): rms error from the fitted BLOS in the core to the samples, scaled with the magnitude of the retrieved LOS magnetic field. Panel (d): same as panel c, but for the wings. Panel (e): difference of the retrieved ∣BLOS∣ in the wings and the core. In all panels, the black contour outlines the outer edge of the penumbra, and the red lines outline the umbra. The markers correspond to the locations of the selected profiles in Figure 2.
Other Images in This Article
Copyright and Terms & Conditions
© 2026. The Author(s). Published by the American Astronomical Society.

