

Image Details
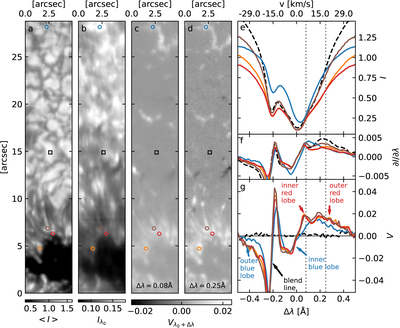
Caption: Figure 2.
Stokes I and V maps and sample profiles from the SUSI observation. Panel (a) shows the Stokes I averaged over the entire observed wavelength range around 401.1 nm. Panel (b) shows the intensity at the rest wavelength of the line. Panels (c) and (d) show V from the flank of the line core and the wing, respectively. Panels (e)–(g) show the Stokes I, ﹩\frac{\partial I}{\partial \lambda }﹩, and Stokes V for the example points marked in panels (a)–(d). The blue, orange, red, and brown circles in panels (a)–(d) mark the locations of the profiles of the corresponding color in panels (e)–(g). The black dashed profiles are from a reference point in a granule marked with the black square. The vertical dashed lines mark the wavelengths shown in panels (c) and (d), respectively.
Other Images in This Article
Copyright and Terms & Conditions
© 2026. The Author(s). Published by the American Astronomical Society.

