

Image Details
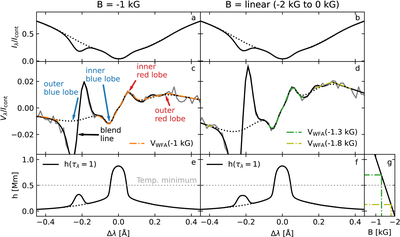
Caption: Figure 1.
A synthesized sample profile of the Fe I 407.17 nm line from the FALC atmospheres with a −1 kG constant, vertical magnetic field (panels (a), (c), and (e)) and linearly varying from -2 to 0 kG vertical magnetic field (panels (b), (d), (f), and (g)). Panels (a) and (b) show Stokes I normalized to the nearby continuum, panels (c) and (d) show the Stokes V profiles, and panels (e) and (f) show the τλ = 1 heights. The Stokes I and Stokes V profiles were convolved with the SUSI spectral PSF. The solid black lines show the results from the synthesis including the nearby blend lines from the Kurucz line list, while the dashed black lines show the results from the synthesis without the blend lines. The solid gray lines in panels (c) and (d) have the blend lines and an additional Poisson noise of approximately 0.2% in the Stokes I continuum. Panel (g) shows the vertical magnetic field stratification used to obtain panels (b), (d), and (f). In panels (c) and (d), the Stokes V profiles generated by applying the WFA (i.e., ﹩{V}_{{\rm{WFA}}}\propto {B}_{{\rm{LOS}}}\frac{\partial I}{\partial \lambda }﹩) on the lines are shown in orange and green with dashed–dotted lines. For the WFA results on the height-dependent vertical magnetic field in panel (d), the equivalent heights where the BLOS reaches these values are shown in panel (g) as the green dashed–dotted lines. The height of the temperature minimum in the FALC model is marked with the gray dotted line in panels (e) and (f). In panel (c), we mark the location of the inner and outer lobes of the Stokes V profile, which correspond to the flanks of the line core and the line wings, respectively.
Other Images in This Article
Copyright and Terms & Conditions
© 2026. The Author(s). Published by the American Astronomical Society.

