

Image Details
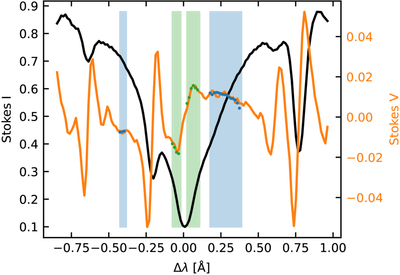
Caption: Figure 3.
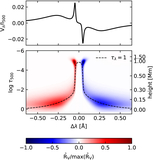
Example of fitting the line core and line wing with the WFA. Here Bwing = ( −1460 ± 290)G (blue shaded area and blue points) and Bcore = ( −1100 ± 120)G (green shaded area and green points). The observed profile was taken from the inner penumbra of the sunspot.
Other Images in This Article
Copyright and Terms & Conditions
© 2026. The Author(s). Published by the American Astronomical Society.

Copyright ©
2026 Astronomy Image Explorer. All Rights Reserved.
