

Image Details
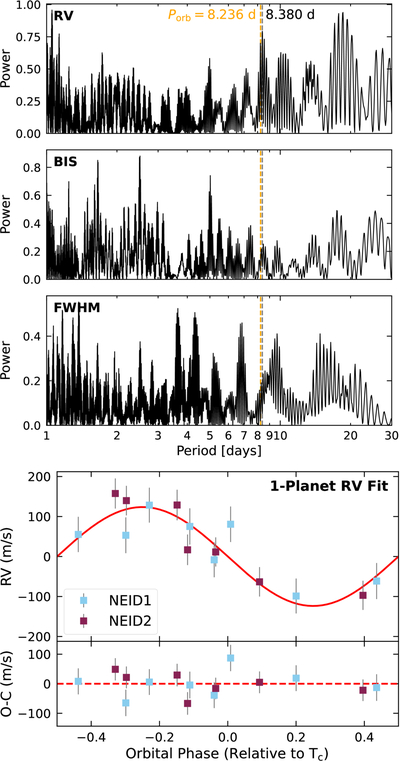
Caption: Figure A2.
Top: Lomb–Scargle periodograms of the NEID RV, BIS, and FWHM measurements. There is a cluster of peaks close to Porb = 8.236 days, with the fine structure due to aliasing with a 432 day peak in the window function representing the characteristic spacing between the two observing seasons. Bottom: phase-folded RV data (squares) and best-fit model (red line) from a single Keplerian fit to the RV data, with P held fixed to Porb and Tc allowed to vary within ±6 hr of the best-fit linear ephemeris to the transit data. The error bars shown here include both the instrumental uncertainties and a fitted jitter value, added in quadrature.
Other Images in This Article
Copyright and Terms & Conditions
© 2026. The Author(s). Published by the American Astronomical Society.

