

Image Details
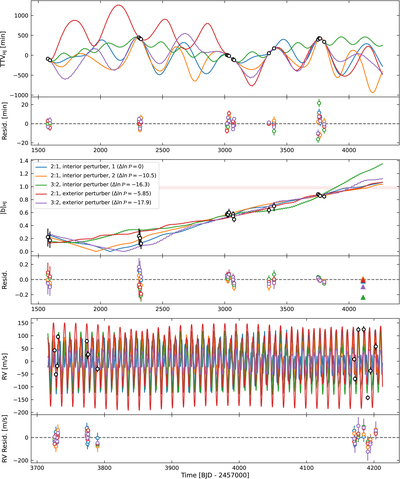
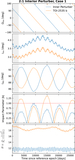
Caption: Figure 5.
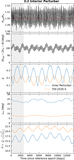
Predicted transit times, impact parameters, and radial velocities for representative system architectures close to the 2:1 and 3:2 period commensurabilities. All of the plotted models produce reasonably good fits to the data, with log posterior probabilities within 20 of each other. The colored points in the residual panels show the residuals with respect to the corresponding model, with the RV residuals having error bars inflated by adding the best-fit jitter term in quadrature. In the middle panel, the red shaded region denotes the nondetection constraint from Sector 101.
Other Images in This Article
Copyright and Terms & Conditions
© 2026. The Author(s). Published by the American Astronomical Society.

Copyright ©
2026 Astronomy Image Explorer. All Rights Reserved.
