

Image Details
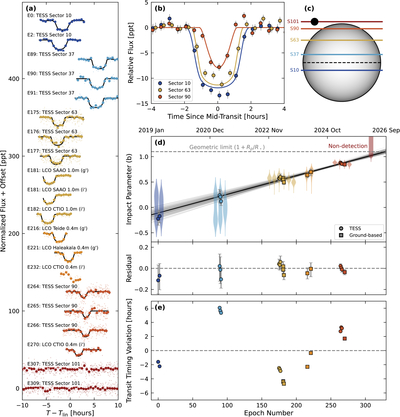
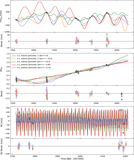
Caption: Figure 1.
(a) TESS and ground-based transit observations of TOI-2535b, phased to the best-fit linear ephemeris. Larger circles show the data binned to 1800s cadence. Transits are arranged chronologically with the earliest at the top, labeled by their epoch number. The best-fit model from our light-curve fitting (Section 3.1) is shown in black. For reference, data from TESS Sector 101 are shown, with no obvious transit events throughout the full range of orbital phases spanned by the observed TTV amplitude. (b) TESS transits from sectors 10, 63, and 90. Each sector’s observations have been phase-folded and shifted to the best-fit local ephemeris, removing the TTVs, and binned to 1800s. (c) Schematic showing the movement of the transit chord across the stellar disk. Each line represents the median impact parameter measured in each TESS sector. The dark circle shows the relative size of the planet to the star. (d) Measured impact parameters for each transit. The violin plots show the posterior distribution of b at each epoch, with the width representing the probability density. For clarity, the individual distributions have been offset horizontally. The solid black line shows the median result from fitting the inferred impact parameters with a linear trend (Section 4.1), while the light gray lines show 100 draws from the posterior distribution for this linear fit. The points with error bars show the median and 1σ uncertainties on the unsigned impact parameter ∣b∣, under the assumption that the transit chord in Sector 10 is on the opposite hemisphere from those in the later sectors, as implied by the linear model. (e) Extracted transit times of TOI-2535b, after subtracting the best-fit linear ephemeris. Note that the per-transit timing uncertainties (2–3 minutes) are too small to be visible on this scale.
Other Images in This Article
Copyright and Terms & Conditions
© 2026. The Author(s). Published by the American Astronomical Society.

