

Image Details
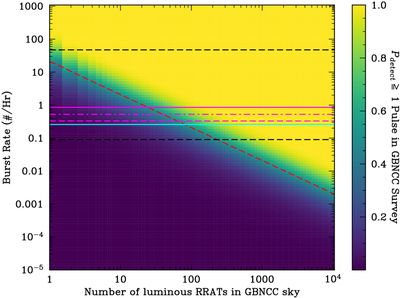
Caption: Figure 8.
The probability of detecting at least one pulse from one extremely luminous RRAT in the GBNCC Survey. The black-dashed line shows the mean and minimum burst rates of RRATs in the RRATalogue. We note that these rates are likely biased high, as RRATs with low burst rates have no measurement. The red dashed diagonal line is the P = 0.5 contour. The magenta solid, dashed–dotted, and dashed lines (in descending order) show the burst rate of PSR J2108+5055 in aggregate, mode 1, and mode 0, respectively. The cyan solid line shows the Speak > 100 Jy PSR J2108+5055 burst rate, where Speak is the peak flux density. The PSR J2108+5055 burst rates are provided in Table 1.
Other Images in This Article
Copyright and Terms & Conditions
© 2026. The Author(s). Published by the American Astronomical Society.

