

Image Details
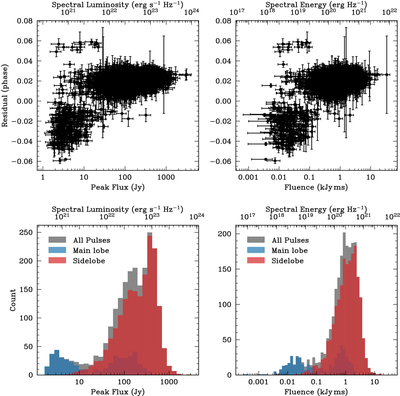
Caption: Figure 6.
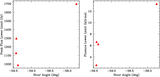
The top row shows the timing residuals plotted against the peak flux density and fluence. We note that across both timing residual figures, there is a clear separation between two distinct emission modes, as indicated by both intrinsic brightness and residuals. The bottom row shows histograms of the peak flux and fluence. The histograms appear bimodal; however, these histograms are not corrected for the complex selection effects of the CHIME/FRB system.
Other Images in This Article
Copyright and Terms & Conditions
© 2026. The Author(s). Published by the American Astronomical Society.

Copyright ©
2026 Astronomy Image Explorer. All Rights Reserved.
