

Image Details
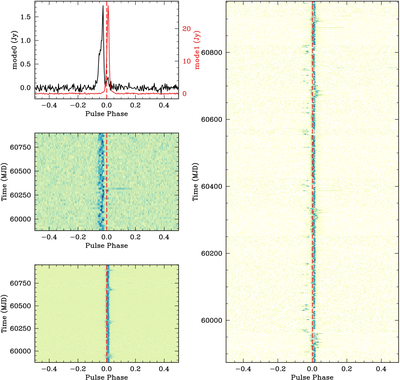
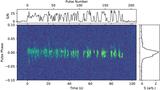
Caption: Figure 2.
Top left: average pulse profile of mode 0 and mode 1. Middle left: intensity versus phase for mode 0. Bottom left: intensity versus phase for mode 1. Right: mean pulse profile of both mode 0 and mode 1. Modes 0 and 1 are independently scaled so that mode 0 is visible; otherwise, mode 1 dominates the color scale. The red dotted vertical line indicates a pulse phase of 0, consistent with other figures in this study.
Other Images in This Article
Copyright and Terms & Conditions
© 2026. The Author(s). Published by the American Astronomical Society.

Copyright ©
2026 Astronomy Image Explorer. All Rights Reserved.
