

Image Details
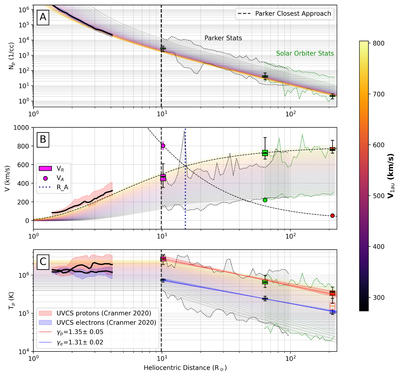
Caption: Figure 4.
Properties of the peak of the stream as a function of heliocentric distance in historical and statistical context. Panels (A)–(C) show plasma density, proton and Alfvén speed (middle), and proton and electron temperatures. Each panel shows a box plot of the Parker (magenta), Solar Orbiter (lime), and Wind measurements (red) of the respective property, where the box plot whiskers are chosen to span the 1st and 99th percentiles of the peak measurements. In the background, a statistical dataset of measurements from Parker (black/gray) and Solar Orbiter (green) are draw the 1st and 99th percentiles in different distance bins (faint shading, bounded by dotted curves). Additionally, a set of “isopoly” curves with external forcing (J.-B. Dakeyo et al. 2022; C. Shi et al. 2022a; Y. J. Rivera et al. 2024, 2025a) which spans the dataset (S. T. Badman et al. 2025) is overlaid and colorized from yellow to purple according to the speed at 1 au and the best matching velocity and related Alfvén speed profile highlighted in (B) with black dashed curves. A vertical blue dashed line in B shows the estimated Alfvén critical point for this stream. Lastly, black lines and red/blue (proton/electron) shading indicate the median and interquartile ranges of corresponding PCH properties inferred from UVCS at low coronal heights (S. R. Cranmer 2020a).
Other Images in This Article
Copyright and Terms & Conditions
© 2026. The Author(s). Published by the American Astronomical Society.

