

Image Details
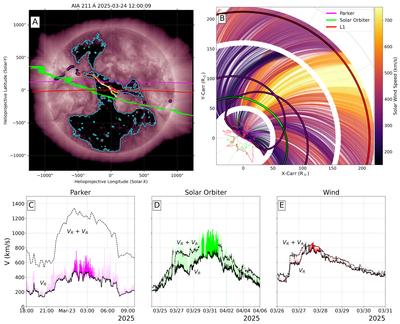
Caption: Figure 1.
PCH-L fast wind stream measured at 3 points in the inner heliosphere. (A) An EUV 211 Å image of the Sun on 2025 March 24 shows a large positive polarity coronal hole, outlined in cyan using a simple intensity threshold. The trajectories of Parker (magenta), Solar Orbiter (lime), and Wind at the Earth–Sun L1 point (red), ballistically mapped to 2.5 R⊙, are projected onto the image. Resulting PFSS magnetic footpoints traced to 1 R⊙ are colorized by the measured velocity. The three sets of footpoints closely overlap and appear as a single trace. (B) Spacecraft trajectories plotted in the solar equatorial plane and used to draw Parker spiral lines using the measured velocity over annular ranges of distance corresponding to each spacecraft, and colorized by wind speed identically to the footpoints in (A). Magenta/lime/red spiky curves close to the Sun show Alfvén surface shapes inferred from each spacecraft. (C)–(E) Radial proton velocity time series from each spacecraft. The native resolution measurements are shown colorized as with the trajectories in (A), median-filtered baselines are plotted in black, and the sum of the median velocity and Alfvén speed is overlaid in fainter black in each panel. The region corresponding to the peak of the stream is highlighted with a higher opacity.
Other Images in This Article
Copyright and Terms & Conditions
© 2026. The Author(s). Published by the American Astronomical Society.

