

Image Details
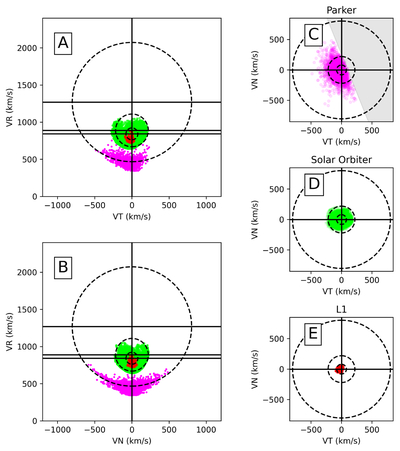
Caption: Figure 3.
Evolution of velocity fluctuations in the fast wind stream. Measured vector components of the proton velocity measured by Parker (magenta), Solar Orbiter (lime), and Wind (red) are displayed in various combinations. Left column: VR versus VT (top) and VN (bottom) are displayed for all three spacecraft measurements, with their respective “Alfvén spheres” overlaid as dashed circles. Solid crosshairs indicate the centroid of each sphere, which is interpreted to be the stream’s de Hoffman–Teller velocity. Right column: corresponding plots of VN versus VT, showing the projection of the fluctuations perpendicular to the radial direction. These are separated by spacecraft from top to bottom, avoiding overlap of the data points, with all three Alfvén sphere projections displayed in each case. In the top right panel, gray shading indicates the region of velocity space outside the SPAN-i FOV at this time and is observed to accurately correspond to the apparent diagonal cutoff in the Parker VN–VT data (magenta).
Other Images in This Article
Copyright and Terms & Conditions
© 2026. The Author(s). Published by the American Astronomical Society.

