

Image Details
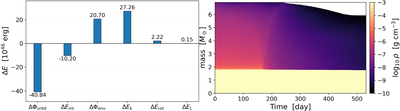
Caption: Figure C1.
Left: the energy differences between the average from day 180 to 200 and the initial state for the six decomposed energy components. Right: Kippenhahn diagram of the density showing the mass loss and significant envelope expansion.
Other Images in This Article
Copyright and Terms & Conditions
© 2026. The Author(s). Published by the American Astronomical Society.

Copyright ©
2026 Astronomy Image Explorer. All Rights Reserved.
