

Image Details
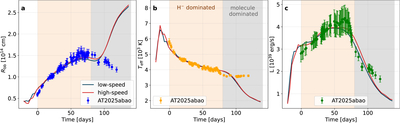
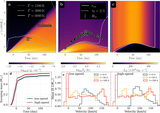
Caption: Figure 5.
Simulations of the low-speed (blue lines) and high-speed (red lines) ejecta compared with the observations. The simulation times are shifted to match the observed bolometric light curve. (a)–(c) Best-fit evolution of Rbb, Teff, and L from the multiwavelength photometry and from radiative-transfer postprocessing of the RHD results with RADMC-3D (see Appendix E for details).
Other Images in This Article
Copyright and Terms & Conditions
© 2026. The Author(s). Published by the American Astronomical Society.

Copyright ©
2026 Astronomy Image Explorer. All Rights Reserved.
