

Image Details
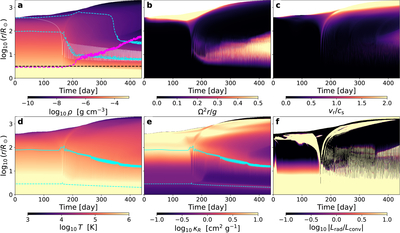
Caption: Figure 2.
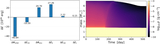
MESA simulation of the representative binary model, using the angular-momentum-conserving framework ( Appendix C). (a)–(f) The evolution of the density, the ratio of centrifugal force to gravity, the ratio of radial velocity to local sound speed, the temperature, the Rosseland mean opacity, and the ratio of the local radiative to convective luminosity. In (a), the cyan dashed lines mark ρ = {10−8, 10−6} g cm−3; the white dotted and black dashed lines show the binary separation and the tidal disruption separation; and the pink line shows the 90% helium mass-fraction contour, marking the boundary of the helium envelope. The cyan solid lines in (d) and (e) mark T = {2 × 10⁵, 2 × 10⁶} K, the two opacity bumps arising from iron-group transitions.
Other Images in This Article
Copyright and Terms & Conditions
© 2026. The Author(s). Published by the American Astronomical Society.

