

Image Details
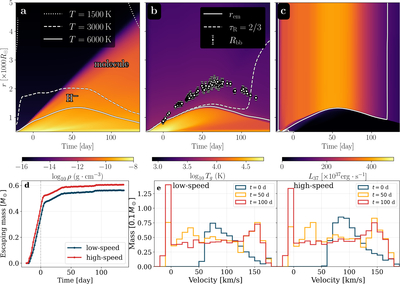
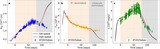
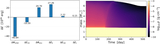
Caption: Figure 4.
Evolution of the low-speed ejecta, shifted in time to fit the observed bolometric light curve. (a)–(c) The density, temperature, and radiative luminosity, respectively. The density panel is overplotted with T = {1500, 3000, 6000} K contours. The temperature panel is overplotted with the conventional photospheric surface τR = 2/3, the photon-emission sphere rem (defined in Appendix E), and the blackbody radius fitted to the multiwavelength observations. The white line in panel (c) shows LEdd, based on the electron-scattering opacity κR = 0.34 cm2 g−1. (d) Escaping mass of the RHD ejecta. (e) The ejecta velocity distributions of both low- and high-speed solutions at t = {0, 50, 100} days.
Other Images in This Article
Copyright and Terms & Conditions
© 2026. The Author(s). Published by the American Astronomical Society.

